Company revenue by product line (pie charts)
IELTS Academic Task 1 pie charts comparing a technology company's revenue sources in 2010 and 2020.
Band 6.5
Prompt: The pie charts below show the sources of revenue for a technology company in 2010 and 2020. Summarise the information by selecting and reporting the main features, and make comparisons where relevant.
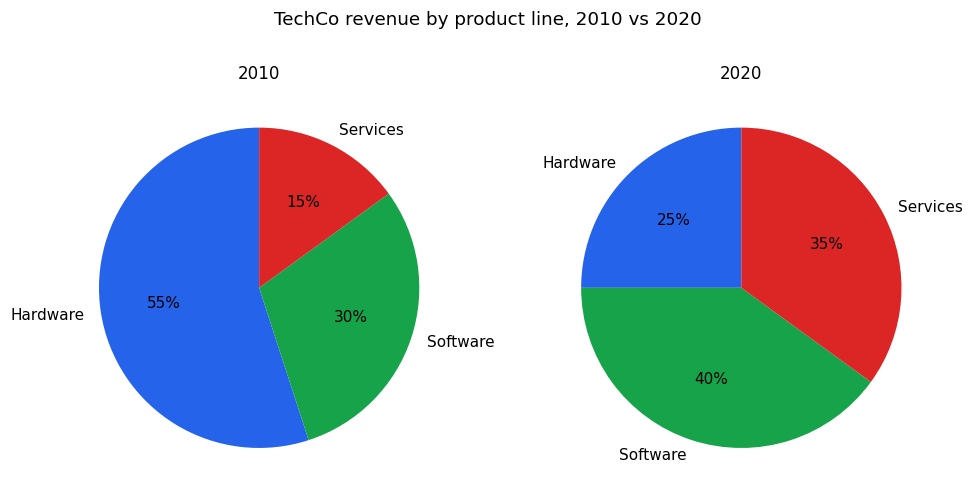
The two pie charts show the sources of revenue for a technology company, TechCo, in 2010 and 2020. The revenue comes from three product lines, and the figures are given as percentages.
In 2010, hardware was the main source of revenue, making up 55% of the total. Software accounted for 30%, while services made up the smallest share at 15%.
By 2020, the situation had changed considerably. Hardware fell sharply to just 25%, so it was no longer the biggest source. Software became the leading product line at 40%, and services more than doubled its share to 35%.
Overall, the company became much less dependent on hardware over the ten years, while both software and services grew in importance, making the three revenue sources far more balanced in 2020 than they had been in 2010.
Band 8.0
Prompt: The pie charts below show the sources of revenue for a technology company in 2010 and 2020. Summarise the information by selecting and reporting the main features, and make comparisons where relevant.
The two pie charts compare the sources of revenue for TechCo, divided among hardware, software and services, in 2010 and 2020.
Overall, the company's income shifted away from a heavy reliance on hardware towards a more balanced distribution, with software becoming the leading source of revenue and services growing markedly over the decade.
In 2010, hardware was by far the dominant revenue stream, generating 55 per cent of the company's income - more than the other two categories combined. Software accounted for 30 per cent, while services contributed the smallest share at just 15 per cent.
By 2020, this pattern had been substantially reversed. Hardware's contribution had fallen to only 25 per cent, less than half of its earlier proportion. Software, meanwhile, had risen to 40 per cent, making it the largest single source of revenue. The most striking change was in services, whose share more than doubled from 15 to 35 per cent, bringing it almost level with software. The company thus moved from a hardware-centred model to one led by software and services.