Household energy use by purpose (pie chart)
IELTS Academic Task 1 practice: describe a pie chart showing how energy is consumed in the average household by end use.
Band 7.0
Prompt: The pie chart below shows how energy is consumed in the average household by end use in 2023. Summarise the information by selecting and reporting the main features, and make comparisons where relevant.
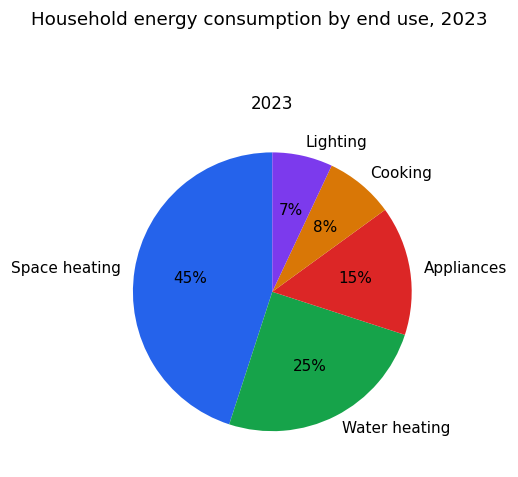
The pie chart shows how energy was used in an average household in 2023, broken down into five end uses.
Overall, heating of some kind accounted for the majority of household energy, while cooking and lighting together made up only a small share.
Space heating was clearly the largest single use, taking up 45% of the total — nearly half of all energy consumed. Water heating was the second biggest category at 25%, meaning that heating for space and water combined represented 70% of household energy use.
The remaining energy was divided among three smaller uses. Appliances accounted for 15%, while cooking and lighting made up the smallest shares, at 8% and 7% respectively. These two categories together contributed just 15%, the same proportion as appliances alone. Overall, the chart shows that keeping homes and water warm dominated domestic energy demand, far outweighing all other uses.
Band 8.0
Prompt: The pie chart below shows how energy is consumed in the average household by end use in 2023. Summarise the information by selecting and reporting the main features, and make comparisons where relevant.
The pie chart shows how energy is consumed in the average household, broken down by end use, in 2023.
Overall, heating dominates domestic energy consumption, with space and water heating together accounting for the large majority of the total. Lighting and cooking, by contrast, use only a small share.
Space heating is easily the largest single category, making up 45 per cent of household energy use — close to half of the total. Water heating comes second, at 25 per cent. Taken together, these two heating uses therefore represent 70 per cent of all the energy consumed in the home.
The remaining 30 per cent is divided among three smaller categories. Appliances account for 15 per cent of consumption, which makes them almost twice as significant as either cooking or lighting individually. Cooking uses 8 per cent, while lighting requires the least energy of all, at just 7 per cent. Overall, while heating is the decisive factor in household energy demand, the amounts used for cooking and lighting are comparatively minor.