Life expectancy by gender (line graph)
IELTS Academic Task 1 practice: describe a line graph comparing male and female life expectancy at birth over four decades.
Band 6.5
Prompt: The line graph below shows life expectancy at birth for men and women in Country Z from 1980 to 2020. Summarise the information by selecting and reporting the main features, and make comparisons where relevant.
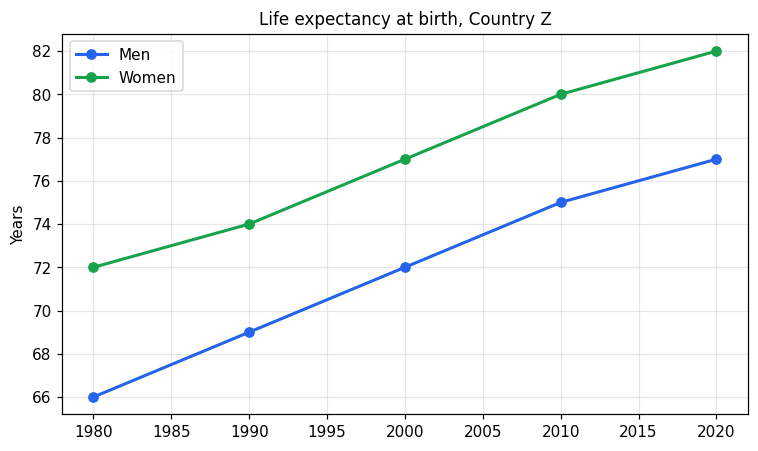
The line graph shows the life expectancy at birth for men and women in Country Z between 1980 and 2020.
Overall, life expectancy increased for both men and women during this period. Women could always expect to live longer than men throughout the whole time shown.
In 1980, men had a life expectancy of 66 years, while women had a higher figure of 72 years. Over the following decades, both numbers went up steadily. By 2000, men reached 72 years and women reached 77 years.
The upward trend continued and in 2020 male life expectancy was 77 years. Female life expectancy was 82 years in the same year, which was the highest point on the graph. The gap between men and women stayed at around five or six years across the whole period.
Band 8.0
Prompt: The line graph below shows life expectancy at birth for men and women in Country Z from 1980 to 2020. Summarise the information by selecting and reporting the main features, and make comparisons where relevant.
The line graph compares life expectancy at birth, in years, for men and women in Country Z between 1980 and 2020.
Overall, life expectancy rose steadily for both sexes over the four decades. Women could consistently expect to live longer than men, although the gap between them narrowed slightly during the period.
In 1980, men had a life expectancy of 66 years, while women were expected to live to 72, a difference of six years. Male life expectancy then climbed at regular intervals, reaching 69 years in 1990, 72 in 2000 and 75 in 2010, before arriving at 77 years by 2020 — an overall gain of eleven years.
Female life expectancy followed a similar upward path, increasing from 72 years in 1980 to 74 in 1990 and 77 in 2000. It continued to 80 years in 2010 and finished at 82 years in 2020, ten years higher than in 1980. Consequently, the difference between the sexes settled at a steady five years from 1990 onwards.