Natural gas production by country (grouped bar chart)
IELTS Academic Task 1 practice: describe a grouped bar chart comparing natural gas production in four countries in 2010 and 2020.
Band 6.5
Prompt: The bar chart below shows natural gas production in four countries in 2010 and 2020. Summarise the information by selecting and reporting the main features, and make comparisons where relevant.
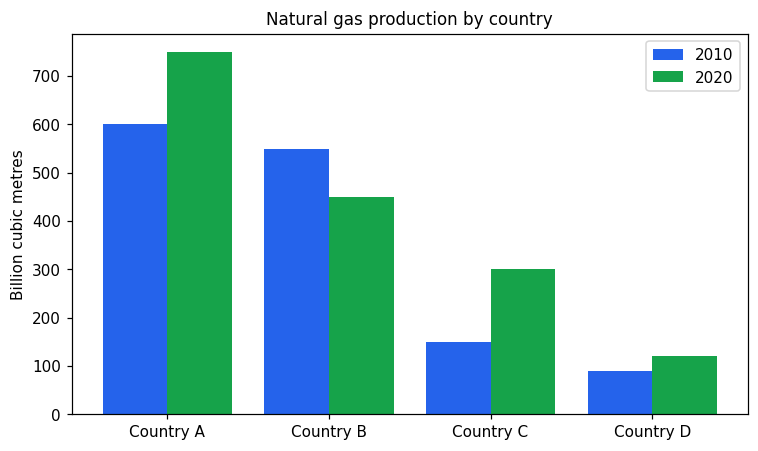
The bar chart compares the amount of natural gas produced by four countries, labelled A to D, in the years 2010 and 2020. The figures are given in billion cubic metres.
Country A was the largest producer in both years. Its production grew from 600 billion cubic metres in 2010 to 750 in 2020. Country C also saw a rise, doubling from 150 to 300 billion cubic metres.
Country B was different because its production fell, going down from 550 in 2010 to 450 in 2020. Country D produced the least gas in both years, but it increased slightly from 90 to 120 billion cubic metres.
Overall, most of the countries produced more natural gas in 2020 than in 2010, with only Country B showing a decrease, while Country A remained clearly the biggest producer throughout.
Band 7.5
Prompt: The bar chart below shows natural gas production in four countries in 2010 and 2020. Summarise the information by selecting and reporting the main features, and make comparisons where relevant.
The bar chart compares natural gas output in four countries, referred to as A, B, C and D, in 2010 and 2020, measured in billion cubic metres.
Overall, production rose in three of the four countries over the decade, with Country A remaining the dominant producer throughout, while Country B was the only nation to record a decline.
Country A was comfortably the largest producer in both years, its output climbing from 600 billion cubic metres in 2010 to 750 billion in 2020. Country C experienced the most striking change in relative terms, with production exactly doubling from 150 to 300 billion cubic metres, which allowed it to close the gap on Country B.
Country B, by contrast, moved in the opposite direction, falling from 550 to 450 billion cubic metres. Country D consistently generated the smallest volumes, though it too registered a modest rise, from 90 to 120 billion cubic metres. As a result, the differences between the four countries narrowed somewhat by 2020.