Land use change 2000 vs 2020 (two pie charts)
IELTS Academic Task 1 practice: describe two pie charts comparing how land was used in a country in 2000 and 2020.
Band 6.5
Prompt: The pie charts below show how land was used in Country X in 2000 and 2020. Summarise the information by selecting and reporting the main features, and make comparisons where relevant.
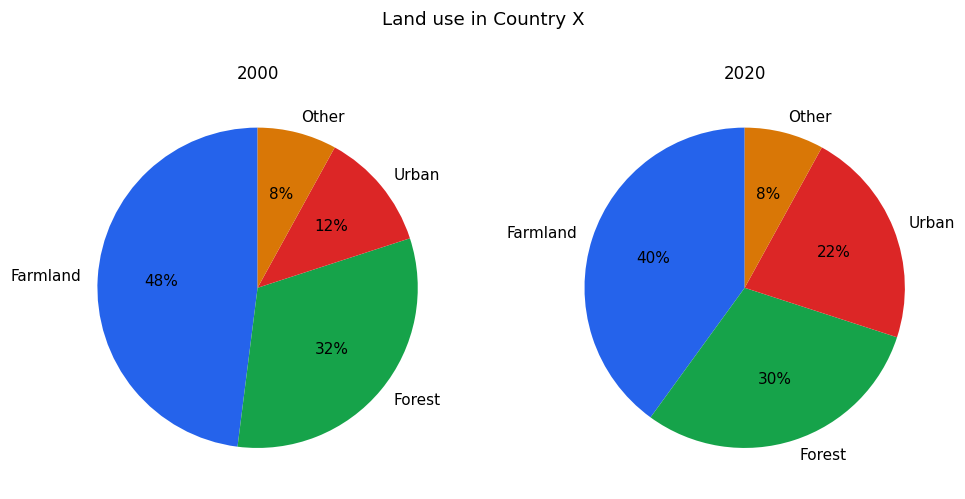
The two pie charts show how land was used in Country X in 2000 and in 2020. The figures are given as percentages.
In 2000, farmland was the biggest category, taking up 48% of the land. Forest was second with 32%, while urban land made up only 12% and other uses accounted for 8%.
By 2020, farmland was still the largest, but it had fallen to 40%. Forest also dropped a little to 30%. The most noticeable change was urban land, which almost doubled from 12% to 22%. The 'other' category stayed the same at 8% in both years.
Overall, while farmland remained the main type of land use in Country X, its share decreased over the twenty years, and the biggest change was the growth of urban areas, which took a larger share than farmland and forest had lost.
Band 7.5
Prompt: The pie charts below show how land was used in Country X in 2000 and 2020. Summarise the information by selecting and reporting the main features, and make comparisons where relevant.
The two pie charts illustrate the way land was used in Country X at the start and end of a twenty-year period, in 2000 and 2020, with all figures expressed as percentages.
Overall, farmland remained the single largest land use throughout, yet the clearest development was the marked expansion of urban land, which grew largely at the expense of agricultural and forested areas.
In 2000, agriculture dominated, occupying 48% of the total, while forest covered a further 32%. Urban development, at just 12%, and other uses, at 8%, together made up only a fifth of the land.
Two decades later, the picture had shifted noticeably. Farmland had contracted to 40% and forest had edged down slightly to 30%. The most substantial change concerned urban land, whose share almost doubled to 22%. The proportion classified as 'other', meanwhile, held steady at 8% in both years, making it the only category to remain completely unchanged.