Marriage and divorce rates (line graph)
IELTS Academic Task 1 practice: a line graph tracking marriage and divorce rates per 1,000 people in a European country from 1980 to 2020, with a band 8 answer.
Band 6.5
Prompt: The line graph below shows the rates of marriage and divorce in a European country, measured per 1,000 people, between 1980 and 2020. Summarise the information by selecting and reporting the main features, and make comparisons where relevant.
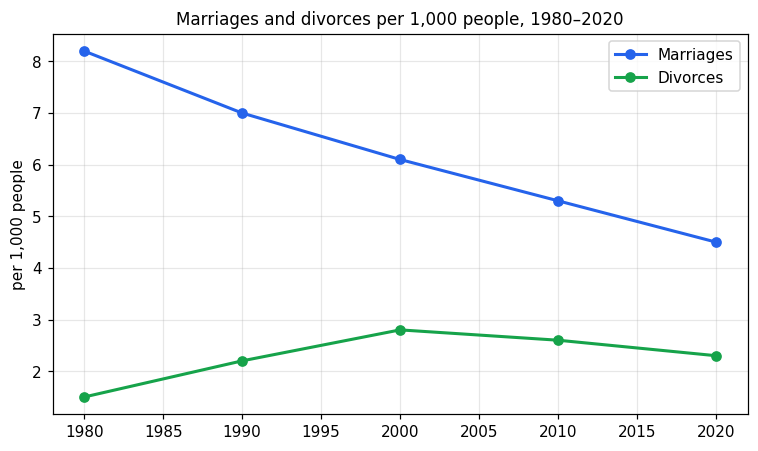
The line graph shows the number of marriages and divorces per 1,000 people in a European country between 1980 and 2020.
Overall, the marriage rate fell steadily over the whole period, while the divorce rate first rose and then fell slightly. Marriages were always more common than divorces.
In 1980, there were 8.2 marriages per 1,000 people. This number went down every ten years, dropping to 7.0 in 1990, 6.1 in 2000 and finally 4.5 in 2020. This was a fall of almost half over the forty years.
The divorce rate started at 1.5 per 1,000 people in 1980. It then increased to reach a peak of 2.8 in 2000. After that, it decreased a little to 2.6 in 2010 and 2.3 in 2020. Although divorces went up at the beginning, the gap between marriages and divorces stayed quite large throughout the period.
Band 8.0
Prompt: The line graph below shows the rates of marriage and divorce in a European country, measured per 1,000 people, between 1980 and 2020. Summarise the information by selecting and reporting the main features, and make comparisons where relevant.
The line graph compares the rates of marriage and divorce in a European country, measured per 1,000 people, at ten-year intervals between 1980 and 2020.
Overall, marriage rates declined steadily throughout the period, while divorce rates rose before falling back. Marriages remained more common than divorces in every year shown.
In 1980, there were 8.2 marriages per 1,000 people, by far the highest figure on the graph. This rate then fell continuously over the following four decades, dropping to 6.1 in 2000 and reaching just 4.5 by 2020, which represents almost a halving of the original figure.
Divorces, by contrast, showed a more varied pattern. The rate climbed from 1.5 per 1,000 in 1980 to a peak of 2.8 in 2000, before easing back to 2.6 in 2010 and 2.3 in 2020. As a result of these opposing trends, the gap between the two rates narrowed considerably, from 6.7 points in 1980 to only 2.2 points by the end of the period.