Length of motorway networks (grouped bar chart)
IELTS Academic Task 1 practice: describe a grouped bar chart comparing the length of motorway networks in four countries in 2000 and 2020.
Band 6.0
Prompt: The bar chart below shows the length of the motorway network in four countries in 2000 and 2020. Summarise the information by selecting and reporting the main features, and make comparisons where relevant.
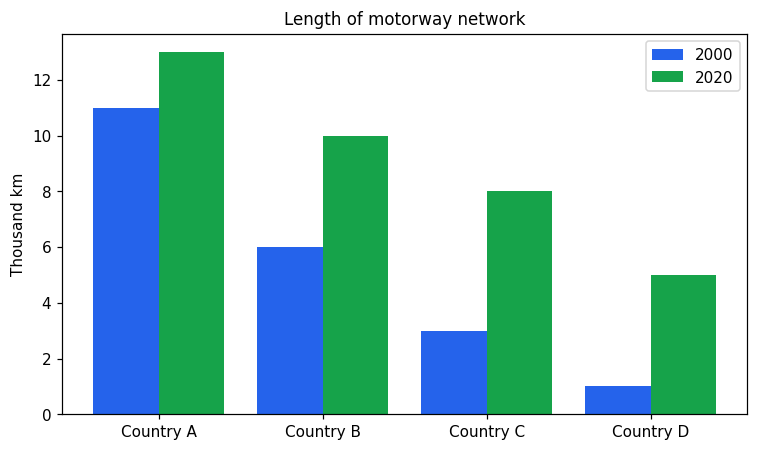
The bar chart shows the length of the motorway network in four countries, called Country A, B, C and D, in the years 2000 and 2020. The numbers are in thousand km.
In 2000, Country A had the longest network at 11 thousand km. Country B had 6, Country C had 3 and Country D had only 1. So Country A was the biggest and Country D was the smallest.
In 2020, all four countries had more motorways. Country A went up to 13 thousand km. Country B went up to 10, Country C to 8 and Country D to 5.
So every country increased from 2000 to 2020. Country A was still the longest in 2020, and Country D had the smallest network in both years. Countries B, C and D grew more than Country A during these years.
Band 8.0
Prompt: The bar chart below shows the length of the motorway network in four countries in 2000 and 2020. Summarise the information by selecting and reporting the main features, and make comparisons where relevant.
The bar chart illustrates the length of the motorway network, in thousand kilometres, in four countries in 2000 and 2020.
Overall, every country expanded its motorway network over the two decades. However, the countries that already had the longest networks grew the least in relative terms, so the gaps between the four narrowed.
In 2000, Country A had the most extensive network at 11 thousand kilometres, well ahead of Country B on 6 thousand, Country C on 3 thousand and Country D on only 1 thousand kilometres. By 2020, Country A still led, but its network had grown only modestly to 13 thousand kilometres.
The other countries expanded much more dramatically. Country B rose from 6 to 10 thousand kilometres, and Country C from 3 to 8 thousand. The most striking growth was in Country D, whose network increased five-fold, from just 1 to 5 thousand kilometres. As a result, although Country A remained in first place, it was no longer so far ahead of the others by the end of the period.