Pet ownership by type (pie chart)
IELTS Academic Task 1 sample: a pie chart showing the proportions of different types of pet owned by households in 2023, with a band 8 model answer.
Band 6.5
Prompt: The pie chart below shows the proportions of different types of pet owned by households in 2023. Summarise the information by selecting and reporting the main features, and make comparisons where relevant.
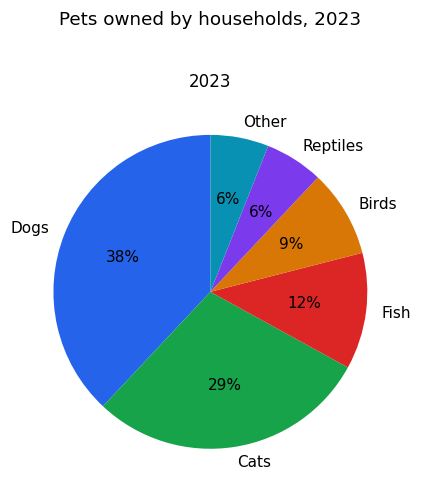
The pie chart shows the proportions of different types of pet owned by households in 2023.
Overall, dogs and cats were by far the most popular pets, while the other types each made up only a small share of the total. Together, dogs and cats accounted for the majority of pets owned.
Dogs were the most common pet, making up 38% of the total. Cats were the second most popular, at 29%, so these two types alone represented more than two thirds of all pets.
The remaining categories had much smaller proportions. Fish accounted for 12% and birds for 9%. Reptiles and the 'other' category were the least common, each making up just 6% of the pets owned by households.
Band 8.0
Prompt: The pie chart below shows the proportions of different types of pet owned by households in 2023. Summarise the information by selecting and reporting the main features, and make comparisons where relevant.
The pie chart shows the proportions of different types of pet owned by households in 2023.
Overall, dogs and cats were by far the most commonly owned pets, together making up roughly two-thirds of the total, while reptiles and other animals were the least popular choices.
Dogs formed the single largest category, accounting for 38% of all pets owned. Cats were the second most common, at 29%. Combined, these two traditional pets represented 67% of the total, dominating the chart and dwarfing every other category.
The remaining third was shared among four smaller groups. Fish made up 12% of pets, making them the most popular of the less common types, followed by birds at 9%. Reptiles and the miscellaneous 'other' category each accounted for just 6%, the smallest shares shown. It is therefore clear that ownership was heavily concentrated in the two leading types, with the other four categories together representing only a third of all pets.