Video game revenue by platform (pie chart)
IELTS Academic Task 1 example: a pie chart showing how global video game revenue was divided among platforms in 2023, with a band 8 model answer.
Band 6.5
Prompt: The pie chart below shows how global video game revenue was divided among different platforms in 2023. Summarise the information by selecting and reporting the main features, and make comparisons where relevant.
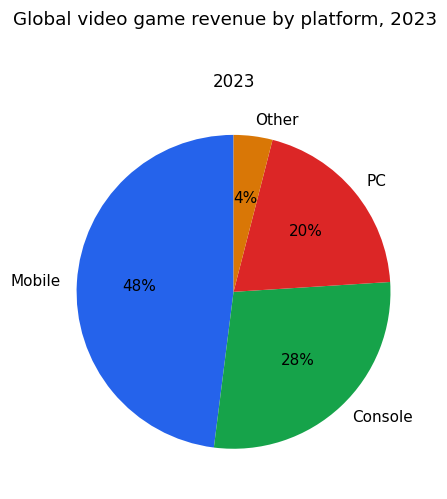
The pie chart shows how global video game revenue was divided among four different platforms in 2023.
Overall, mobile was clearly the largest source of video game revenue, while the 'Other' category made up only a very small share. Together, mobile and console accounted for more than three quarters of the total.
Mobile games generated the biggest proportion of revenue, at 48%, which was almost half of the total. This was well ahead of console games, which came second with 28%.
PC games made up a fifth of global revenue, at 20%, putting them not far behind consoles. Finally, the 'Other' platforms produced the smallest share by far, at just 4%. The gap between the leading platform, mobile, and the smallest, 'Other', was very large, at 44 percentage points.
Band 8.0
Prompt: The pie chart below shows how global video game revenue was divided among different platforms in 2023. Summarise the information by selecting and reporting the main features, and make comparisons where relevant.
The pie chart illustrates how global video game revenue was divided among different platforms in 2023.
Overall, mobile gaming was the dominant source of revenue, generating almost half of the global total, while non-standard platforms contributed only a tiny fraction.
Mobile platforms were responsible for the largest share of revenue, at 48%. This was nearly as much as all the other platforms combined and considerably more than any single competitor. Console gaming ranked second, accounting for just over a quarter of the total at 28%.
PC gaming made up a further 20% of global revenue, placing it third and not far behind consoles. Together, mobile, console and PC therefore accounted for 96% of all earnings. The remaining 'other' platforms, which cover formats outside these three main categories, contributed a negligible 4%. In summary, revenue was clearly led by mobile, with console and PC forming a solid but smaller middle tier, and all other platforms proving commercially insignificant.