How main meals were obtained (line graph)
Academic IELTS Task 1 model answer describing a line graph of how people obtained their main meals over a decade — chart plus band-8 answer.
Band 6.5
Prompt: The line graph below shows how people in City Y obtained their main meals between 2012 and 2022, measured in meals per person per week. Summarise the information by selecting and reporting the main features, and make comparisons where relevant.
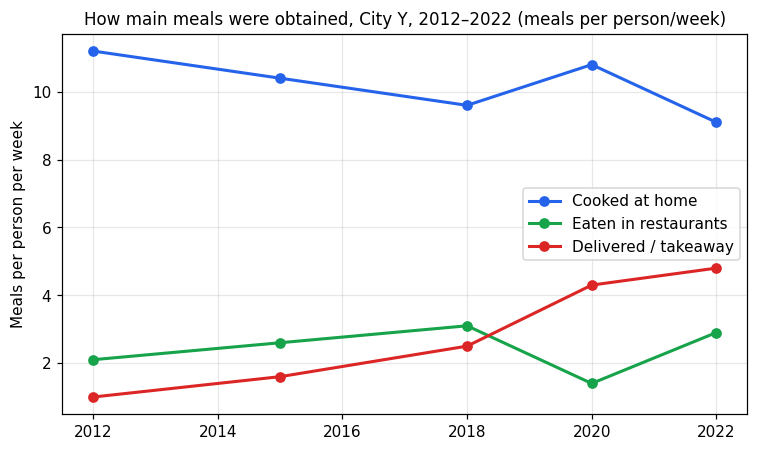
The line graph shows how people in City Y got their main meals from 2012 to 2022, measured in meals per person each week.
Meals cooked at home were the most common way during the whole period. This figure started at 11.2 in 2012 and it went down and up, finishing at 9.1 in 2022. Meals delivered or takeaway increased a lot. They began at only 1.0 in 2012 but rose to 4.8 by 2022.
Meals eaten in restaurants changed less. The number was 2.1 in 2012 and reached 3.1 in 2018, before dropping to 1.4 in 2020 and going back up to 2.9 in 2022.
Overall, home cooking stayed the main source of meals, but the biggest change was the rise in delivery and takeaway meals, which overtook restaurant meals to become the main alternative to home cooking by the end of the period.
Band 8.0
Prompt: The line graph below shows how people in City Y obtained their main meals between 2012 and 2022, measured in meals per person per week. Summarise the information by selecting and reporting the main features, and make comparisons where relevant.
The line graph shows changes in how residents of City Y obtained their main meals between 2012 and 2022, measured in meals per person each week across three categories: home cooking, restaurant dining, and delivery or takeaway.
Overall, home-cooked meals declined over the period but remained the most common by far, while delivery and takeaway grew strongly, overtaking restaurant dining. The most striking change occurred around 2020.
In 2012, people ate 11.2 home-cooked meals a week, compared with only 2.1 restaurant meals and 1.0 delivered meals. Home cooking then fell gradually to 9.6 by 2018, before a temporary rise in 2020 and a further drop to 9.1 in 2022.
Delivery and takeaway rose steadily and then surged, from 1.0 meals a week in 2012 to 4.3 in 2020, ending at 4.8 in 2022. Restaurant dining, meanwhile, climbed modestly to 3.1 by 2018 but fell sharply to 1.4 in 2020 before partially recovering to 2.9. By the end of the period, therefore, delivery had clearly replaced eating out as the main alternative to cooking at home.