Streaming subscriptions by country (line graph)
IELTS Academic Task 1 example: a line graph comparing video streaming subscriptions in three countries from 2015 to 2023, with a band 8 model answer.
Band 6.5
Prompt: The line graph below shows the number of video streaming subscriptions, in millions, in three countries between 2015 and 2023. Summarise the information by selecting and reporting the main features, and make comparisons where relevant.
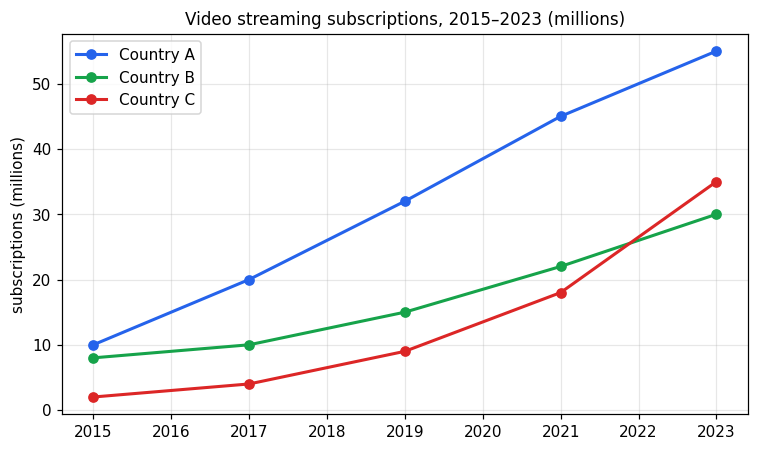
The line graph shows the number of video streaming subscriptions, in millions, in three countries (A, B and C) between 2015 and 2023.
Overall, all three countries saw their subscriptions increase over the period, with Country A remaining the largest for most of the time and Country C growing the fastest.
In 2015, Country A had 10 million subscriptions, Country B had 8 million and Country C had only 2 million. Country A then rose steadily to 32 million in 2019 and then to 55 million in 2023, the highest figure overall. Country B grew more slowly, reaching 15 million in 2019 and 30 million by the end. Country C started the lowest but increased sharply, especially after 2019, jumping from 9 million to 35 million in 2023. By the end of the period, Country C had passed Country B to become the second largest.
Band 8.0
Prompt: The line graph below shows the number of video streaming subscriptions, in millions, in three countries between 2015 and 2023. Summarise the information by selecting and reporting the main features, and make comparisons where relevant.
The line graph shows the number of video streaming subscriptions, in millions, in three countries between 2015 and 2023.
Overall, subscriptions increased substantially in all three countries over the period. Country A held the leading position throughout, whereas Country C experienced the most dramatic growth and overtook Country B towards the end.
In 2015, Country A already had the largest number of subscriptions at 10 million, followed by Country B with 8 million and Country C with just 2 million. Country A then rose sharply and consistently, more than quintupling to 55 million by 2023.
Country B recorded steadier growth, climbing from 10 million in 2017 to 22 million in 2021 and finishing at 30 million. Country C, meanwhile, started from the lowest base but accelerated rapidly, particularly after 2019. Its total reached 18 million in 2021, close to Country B's 22 million, and then surged to 35 million in 2023, thereby moving into second place and pushing Country B into third.