Supermarket packaging by weight (pie chart)
Academic IELTS Task 1 model answer describing a pie chart of packaging types used by a supermarket by weight — chart included with a band-8 answer.
Band 6.0
Prompt: The pie chart below shows the types of packaging used by a supermarket chain in 2023, measured by weight. Summarise the information by selecting and reporting the main features, and make comparisons where relevant.
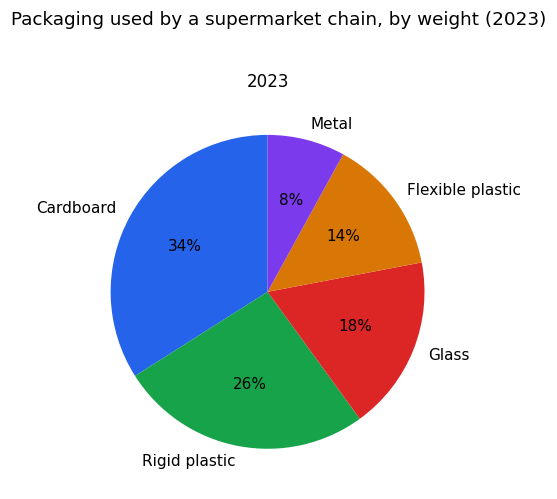
The pie chart gives information about the different types of packaging that were used by a supermarket chain in 2023. The amount of packaging is measured by weight.
It can be seen that cardboard was the type that was used the most. Cardboard made up 34% of the packaging in total. Rigid plastic was the second one and it was 26%. After that, glass was 18% of the packaging.
Then flexible plastic was 14%. Metal was the smallest type and it was only 8%. Cardboard and rigid plastic together made more than half of all the packaging that was used.
Overall, cardboard was the biggest type and metal was the lowest type of packaging in the year 2023.
Band 8.0
Prompt: The pie chart below shows the types of packaging used by a supermarket chain in 2023, measured by weight. Summarise the information by selecting and reporting the main features, and make comparisons where relevant.
The pie chart illustrates the proportion of different packaging materials used by a supermarket chain in 2023, measured by weight.
Overall, cardboard and rigid plastic together accounted for the majority of packaging, while metal made up only a small fraction. Paper- and plastic-based materials clearly dominated over glass and metal.
Cardboard was the single most widely used material, representing just over a third of the total by weight, at 34 per cent. Rigid plastic was the second largest category at 26 per cent, so these two materials combined made up three-fifths of all packaging.
The remaining materials were used in considerably smaller quantities. Glass accounted for 18 per cent and flexible plastic for 14 per cent, while metal was the least used material by some margin, at just 8 per cent. Taken together, the two forms of plastic made up 40 per cent of packaging by weight, a slightly larger share than cardboard alone.