Daily calorie intake by food group (table)
IELTS Academic Task 1 practice: describe a table comparing daily calorie intake from four food groups across three countries.
Band 7.0
Prompt: The table below shows the average daily calorie intake per person from four food groups in three countries. Summarise the information by selecting and reporting the main features, and make comparisons where relevant.
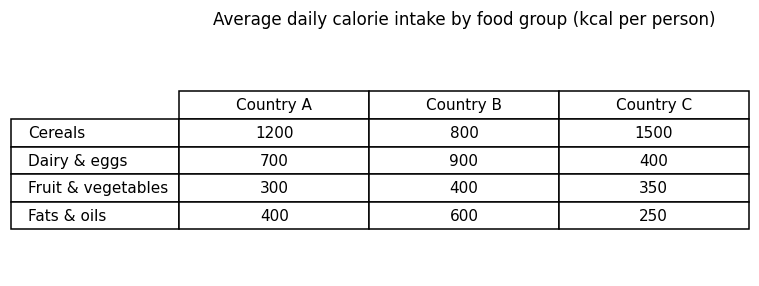
The table shows the average daily calorie intake per person from four food groups — cereals, dairy and eggs, fruit and vegetables, and fats and oils — in three countries.
Overall, cereals provided the most calories in Countries A and C, though in Country B dairy and eggs were the leading source, while the smallest source varied between the countries. There were also notable differences between the three countries.
Cereals were the dominant source in each case, ranging from 800 kcal in Country B up to 1,500 kcal in Country C, the single highest figure in the table. Country A also relied heavily on cereals at 1,200 kcal.
Dairy and eggs varied considerably, from just 400 kcal in Country C to 900 kcal in Country B, where it was the largest source. Fruit and vegetables were low everywhere, between 300 and 400 kcal. Fats and oils ranged from 250 kcal in Country C to 600 kcal in Country B, meaning Country B had the highest intake in three of the four groups.
Band 8.0
Prompt: The table below shows the average daily calorie intake per person from four food groups in three countries. Summarise the information by selecting and reporting the main features, and make comparisons where relevant.
The table compares the average daily calorie intake per person from four food groups in three countries, A, B and C.
Overall, cereals provide the greatest number of calories in Countries A and C, whereas Country B has a more balanced diet with a heavier reliance on animal products and fats. Country B also has the highest total intake of the three.
Cereals are the leading source of energy in Country C, supplying 1,500 calories per person each day, and in Country A, at 1,200. In Country B, however, cereals contribute only 800 calories. Dairy and eggs show the opposite pattern, providing the most calories in Country B (900) and the fewest in Country C (400).
Fruit and vegetables make a fairly similar contribution everywhere, ranging narrowly between 300 and 400 calories. Fats and oils vary more widely: Country B obtains 600 calories from this group, compared with 400 in Country A and just 250 in Country C. Adding the groups together, Country B consumes the most overall, at 2,700 calories, slightly ahead of Country A on 2,600 and Country C on 2,500.