Rail passenger travel in two countries (line graph)
IELTS Academic Task 1 practice: describe a line graph comparing rail passenger travel in two countries measured in billion passenger-kilometres.
Band 6.0
Prompt: The line graph below shows rail passenger travel in two countries from 2005 to 2020. Summarise the information by selecting and reporting the main features, and make comparisons where relevant.
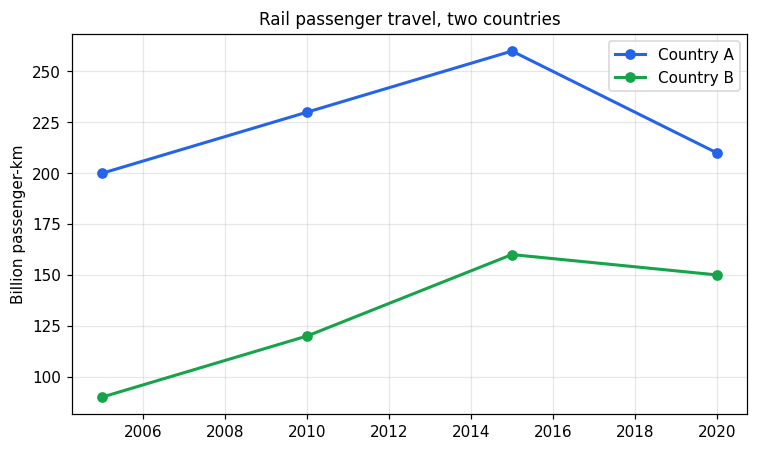
The line graph shows rail passenger travel in two countries, Country A and Country B, from 2005 to 2020. The numbers are measured in billion passenger-km.
In 2005, Country A was 200 billion passenger-km and Country B was 90. Country A was higher than Country B in every year on the graph.
Country A went up from 200 in 2005 to 230 in 2010 and then to 260 in 2015. After that it went down to 210 in 2020. Country B went up from 90 in 2005 to 120 in 2010 and 160 in 2015. Then it went down a little to 150 in 2020.
So both countries went up and then came down at the end. Country A was always more than Country B. The difference between them was 110 in 2005 and it became smaller by 2020.
Band 8.0
Prompt: The line graph below shows rail passenger travel in two countries from 2005 to 2020. Summarise the information by selecting and reporting the main features, and make comparisons where relevant.
The line graph illustrates rail passenger travel, in billion passenger-kilometres, in two countries between 2005 and 2020.
Overall, Country A recorded higher levels of rail travel than Country B throughout the period. Travel in both countries grew until 2015 but then declined in the final five years, and the gap between the two narrowed considerably.
In 2005, passengers in Country A travelled 200 billion passenger-kilometres, more than double the 90 billion recorded in Country B. Country A's figure rose to 230 billion in 2010 and peaked at 260 billion in 2015, before falling back to 210 billion by 2020, only marginally above its starting point.
Country B, meanwhile, expanded more rapidly, climbing from 90 billion in 2005 to 120 billion in 2010 and 160 billion in 2015. It then dipped slightly to 150 billion in 2020. As a result, although Country A remained ahead, the difference between the two countries shrank from 110 billion passenger-kilometres in 2005 to just 60 billion by 2020.