Volunteering rate by gender (line graph)
IELTS Academic Task 1 sample: a line graph showing the percentage of men and women doing regular volunteer work over twenty years, with band 8 model answer.
Band 6.5
Prompt: The line graph below shows the percentage of male and female adults who did regular volunteer work in a particular country between 2000 and 2020. Summarise the information by selecting and reporting the main features, and make comparisons where relevant.
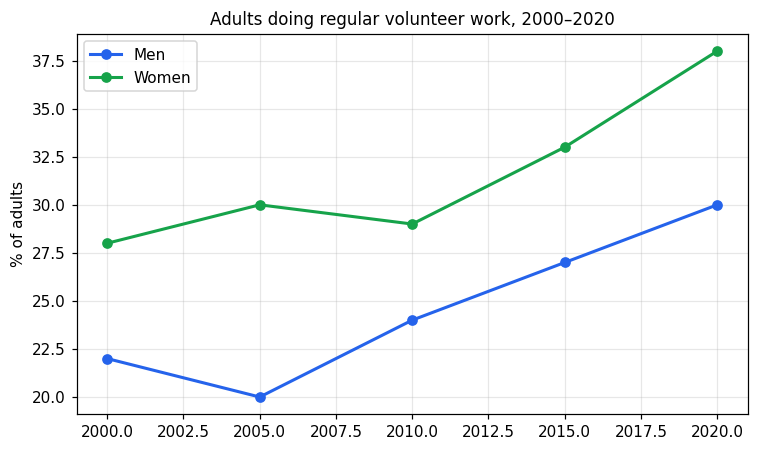
The line graph illustrates the percentage of male and female adults who did regular volunteer work in a particular country from 2000 to 2020.
Overall, the volunteering rate rose for both men and women over the period, and women were more likely to volunteer than men at every point in time.
In 2000, 28% of women did regular volunteer work, compared with 22% of men. The male figure then dipped slightly to 20% in 2005 before starting to rise. For women, the rate stayed fairly stable at around 29 to 30% during the first decade.
After 2010, both figures increased more clearly. By 2020, the percentage of men had climbed to 30%, while the figure for women reached its highest point at 38%. The gap between the two genders was therefore wider at the end than at the beginning.
Band 8.0
Prompt: The line graph below shows the percentage of male and female adults who did regular volunteer work in a particular country between 2000 and 2020. Summarise the information by selecting and reporting the main features, and make comparisons where relevant.
The line graph illustrates the proportion of male and female adults who took part in regular volunteer work in a particular country over a twenty-year period from 2000 to 2020.
Overall, the volunteering rate increased for both sexes across the period. Women were consistently more likely than men to volunteer, and the gap between the two genders widened slightly by the end of the timeframe.
In 2000, 28% of women engaged in regular voluntary activity, compared with 22% of men. Over the following five years, the female figure edged up to 30%, whereas the male rate dipped to 20%, its lowest point on the chart.
From 2005 onwards, both rates followed a broadly upward trend. The percentage of men rose steadily to reach 24% in 2010 and then climbed to 30% by 2020. The proportion of women, having fallen marginally to 29% in 2010, subsequently increased more sharply to 33% in 2015 before peaking at 38% in 2020. Consequently, the difference between women and men grew from six percentage points at the start to eight points at the finish.