Average wheat and rice yields (line graph)
IELTS Academic Task 1 practice: describe a line graph comparing average wheat and rice yields per hectare over thirty years.
Band 6.0
Prompt: The line graph below shows average wheat and rice yields per hectare in Country Y from 1990 to 2020. Summarise the information by selecting and reporting the main features, and make comparisons where relevant.
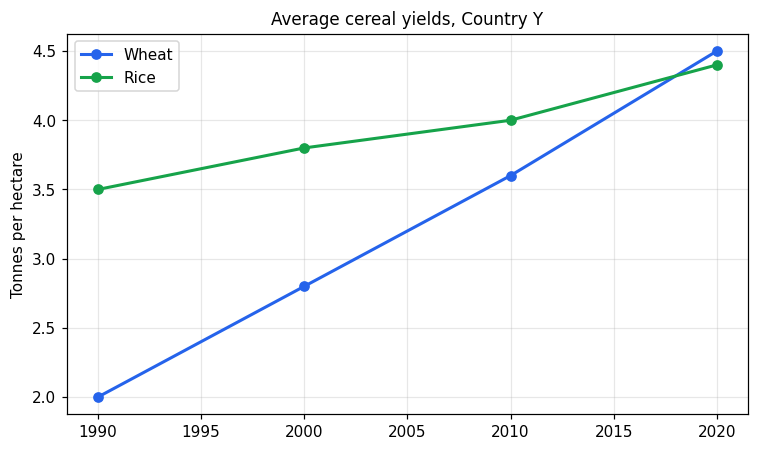
The line graph gives information about the average yields of wheat and rice per hectare in Country Y between 1990 and 2020. The figures are measured in tonnes per hectare.
In 1990, wheat had a yield of 2.0 tonnes per hectare. This number went up over the years. It was 2.8 in 2000 and 3.6 in 2010. In 2020, wheat reached 4.5 tonnes per hectare.
Rice was higher than wheat at the start. The rice yield was 3.5 tonnes in 1990. It also went up, to 3.8 in 2000 and 4.0 in 2010. In 2020, rice was 4.4 tonnes per hectare.
Overall, both wheat and rice increased during this period, and by 2020 the two crops had almost the same yield per hectare.
Band 7.5
Prompt: The line graph below shows average wheat and rice yields per hectare in Country Y from 1990 to 2020. Summarise the information by selecting and reporting the main features, and make comparisons where relevant.
The line graph illustrates changes in the average yields of two cereal crops, wheat and rice, in Country Y over a thirty-year period from 1990 to 2020, with figures given in tonnes per hectare.
Overall, the yields of both crops rose steadily throughout the period. However, wheat experienced far more dramatic growth, so that by the end of the period the substantial gap that had originally separated the two crops had virtually disappeared.
In 1990, rice was considerably more productive than wheat, yielding 3.5 tonnes per hectare compared with just 2.0 tonnes for wheat. Over the following three decades, wheat yields climbed sharply and consistently, reaching 2.8 tonnes in 2000, 3.6 in 2010 and finally 4.5 tonnes per hectare in 2020, more than double the starting figure.
Rice, by contrast, improved much more gradually, edging up from 3.8 tonnes in 2000 to 4.0 in 2010 before ending at 4.4 tonnes in 2020. Consequently, wheat had narrowly overtaken rice by the final year.