Reasons for shopping online (two pie charts)
Academic IELTS Task 1 model answer comparing two pie charts of reasons for online shopping in 2010 and 2022 — chart plus band-8 answer.
Band 7.0
Prompt: The pie charts below show the main reason people gave for shopping online in 2010 and in 2022. Summarise the information by selecting and reporting the main features, and make comparisons where relevant.
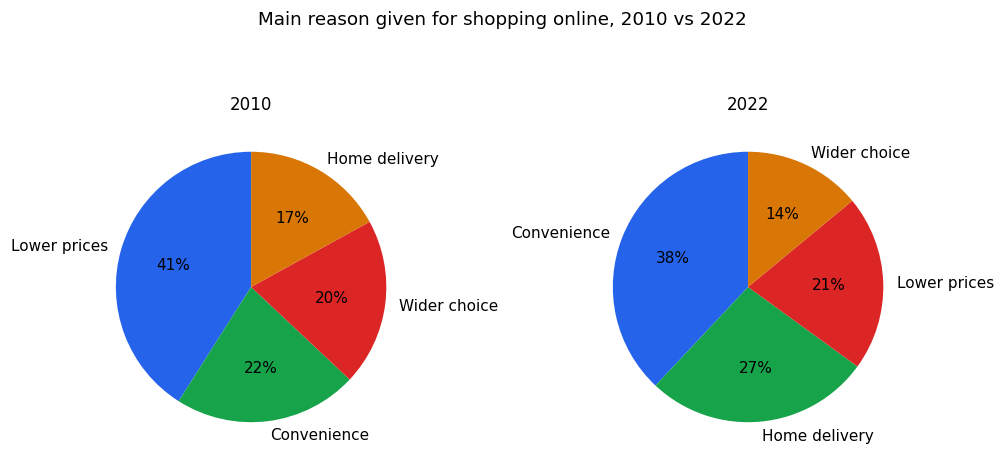
The two pie charts compare the main reasons people gave for shopping online in 2010 and in 2022.
Overall, the most striking change is that lower prices, which was the leading reason in 2010, became far less important by 2022, while convenience and home delivery grew in significance over the period.
In 2010, lower prices was clearly the top reason, chosen by 41% of people. Convenience and wider choice followed, at 22% and 20% respectively, and home delivery accounted for the smallest share at 17%.
By 2022, the picture had changed considerably. Convenience had become the main reason at 38%, and home delivery had risen to 27%, making it the second most common answer. In contrast, lower prices fell sharply to just 21%, around half of its earlier figure. Wider choice also declined, dropping from 20% to 14%, and it was the least popular reason given in 2022.
Band 8.0
Prompt: The pie charts below show the main reason people gave for shopping online in 2010 and in 2022. Summarise the information by selecting and reporting the main features, and make comparisons where relevant.
The two pie charts show the primary reason consumers gave for shopping online in 2010 and 2022, expressed as percentages.
Overall, the leading motivation shifted from price to convenience over the period. While lower prices dominated in 2010, by 2022 convenience and home delivery had become the reasons most frequently cited, suggesting that shoppers came to value ease over cost.
In 2010, lower prices was clearly the main draw, given by 41 per cent of respondents — almost twice the proportion choosing convenience (22 per cent) or wider choice (20 per cent). Home delivery was the least common answer, at 17 per cent.
By 2022 the picture had changed markedly. Convenience had risen to first place with 38 per cent, and home delivery had climbed to 27 per cent. Meanwhile, the importance of lower prices had halved to 21 per cent, and wider choice had fallen to 14 per cent, making it the least selected reason. In short, practical factors overtook financial ones as the decade progressed.