Composition of a country's exports (pie chart)
IELTS Academic Task 1 pie chart showing the composition of Country X's exports by category in 2022.
Band 6.5
Prompt: The pie chart below shows the composition of Country X's exports by category in 2022. Summarise the information by selecting and reporting the main features, and make comparisons where relevant.
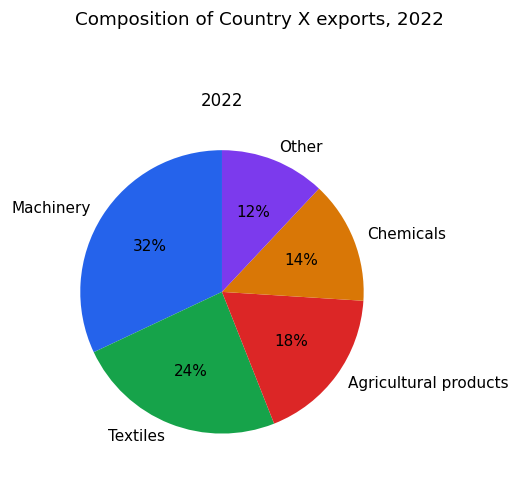
The pie chart shows the composition of Country X's exports by category in 2022, divided into five groups.
Overall, machinery was the largest export category, while the smallest shares came from chemicals and the "Other" group. The exports were fairly spread out across the categories.
Machinery made up the biggest proportion of exports at 32%, almost a third of the total. Textiles were the second-largest category at 24%, followed by agricultural products at 18%. Together, textiles and agricultural products contributed 42%, which was more than machinery on its own. These top three categories accounted for nearly three-quarters of all exports. The two remaining categories were smaller: chemicals represented 14%, and the "Other" category made up 12%, the lowest share of all. So while machinery clearly dominated, no single category was extremely small.
Band 8.0
Prompt: The pie chart below shows the composition of Country X's exports by category in 2022. Summarise the information by selecting and reporting the main features, and make comparisons where relevant.
The pie chart illustrates the composition of Country X's exports in 2022, broken down into five categories by percentage.
Overall, the country's export earnings were dominated by manufactured and processed goods, with machinery and textiles together accounting for well over half of the total, while primary and chemical products made up the remainder.
Machinery was the single largest export category, representing 32 per cent of the total value of exports. Textiles formed the second most significant category, at 24 per cent, meaning that these two categories combined made up 56 per cent of all exports.
The remaining three categories accounted for smaller shares. Agricultural products constituted 18 per cent of exports, a notable but secondary contribution. Chemicals were responsible for a further 14 per cent, while the 'other' category, covering all remaining goods, made up the smallest proportion at 12 per cent. The relatively even split among these last three groups contrasts with the clear dominance of machinery and textiles at the top of the chart.