Online sales by product category (line graph)
IELTS Academic Task 1 line graph comparing online sales of electronics, clothing and groceries between 2016 and 2022.
Band 6.5
Prompt: The line graph below shows online sales, in billions of US dollars, for three product categories between 2016 and 2022. Summarise the information by selecting and reporting the main features, and make comparisons where relevant.
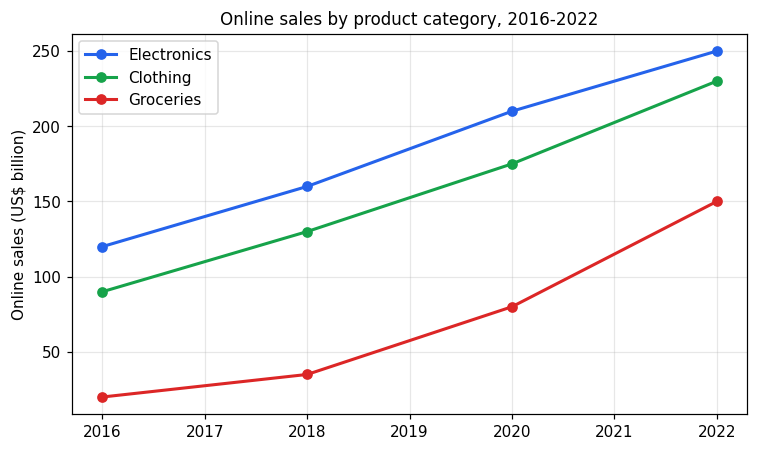
The line graph shows online sales for three product categories — electronics, clothing and groceries — between 2016 and 2022, measured in billions of US dollars.
Electronics had the highest sales throughout the whole period. Sales of electronics rose steadily from $120 billion in 2016 to $250 billion in 2022. Clothing followed a similar pattern, climbing from $90 billion to $230 billion over the same years.
Grocery sales started much lower than the other two categories, at just $20 billion in 2016. However, they grew very quickly, especially after 2018, reaching $80 billion in 2020 and then $150 billion in 2022.
Overall, all three categories increased over the period, but groceries experienced the fastest growth, even though electronics remained the largest category in terms of total online sales by the end.
Band 8.0
Prompt: The line graph below shows online sales, in billions of US dollars, for three product categories between 2016 and 2022. Summarise the information by selecting and reporting the main features, and make comparisons where relevant.
The line graph compares online sales, in billions of US dollars, for three product categories - electronics, clothing and groceries - at two-year intervals between 2016 and 2022.
Overall, online sales rose in all three categories throughout the period. Electronics remained the best-selling category at every stage, but grocery sales grew the most rapidly, substantially narrowing the gap with the other two categories by the end.
In 2016, electronics generated the highest revenue at 120 billion dollars, followed by clothing at 90 billion, while groceries lagged far behind at only 20 billion. Sales of electronics then increased consistently to 160 billion in 2018 and reached 250 billion by 2022.
Clothing followed a similar upward path, more than doubling from 90 billion to 230 billion over the six years, leaving it just below electronics at the close. The most striking change was in groceries, which climbed steeply from 20 billion to 150 billion - a more than sevenfold increase. Although groceries still recorded the lowest sales in 2022, the category had clearly transformed from a minor player into a significant part of the online market.