Cycle lanes and daily cyclists (mixed chart)
IELTS Academic Task 1 practice: describe a combined bar-and-line chart showing the length of cycle lanes and the number of daily cyclists in a city.
Band 6.5
Prompt: The chart below shows the length of cycle lanes and the number of daily cyclists in City X from 2015 to 2023. Summarise the information by selecting and reporting the main features, and make comparisons where relevant.
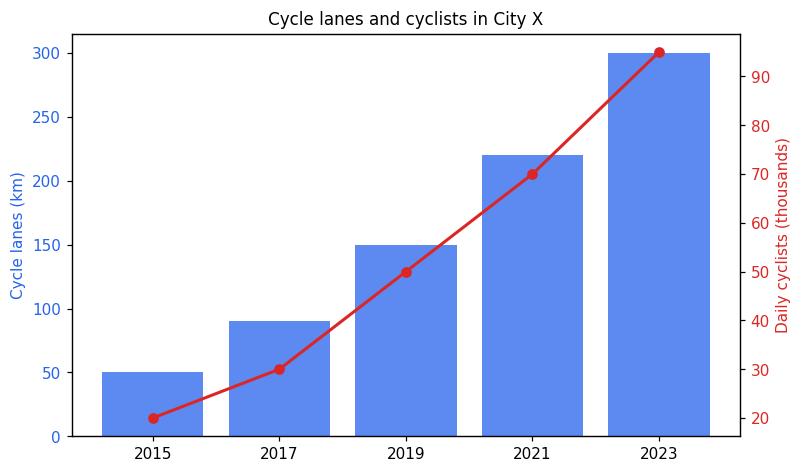
The chart shows the length of cycle lanes in kilometres and the number of daily cyclists in thousands in City X between 2015 and 2023.
Both measures increased strongly over the period. In 2015, there were 50 km of cycle lanes and about 20 thousand daily cyclists. The length of cycle lanes then grew steadily, reaching 90 km in 2017, 150 km in 2019 and 220 km in 2021, before hitting 300 km in 2023.
The number of daily cyclists followed a similar upward pattern. It rose from 20 thousand in 2015 to 50 thousand in 2019, and continued climbing to 95 thousand by 2023.
Overall, the length of cycle lanes and the number of people cycling each day both went up together, and both figures reached their highest point in the final year of the period.
Band 8.0
Prompt: The chart below shows the length of cycle lanes and the number of daily cyclists in City X from 2015 to 2023. Summarise the information by selecting and reporting the main features, and make comparisons where relevant.
The chart shows the length of cycle lanes, in kilometres, and the number of daily cyclists, in thousands, in City X between 2015 and 2023.
Overall, both the cycling infrastructure and the number of people cycling grew continuously throughout the period. The two measures increased broadly in parallel, expanding several times over by the end.
In 2015, the city had 50 kilometres of cycle lanes, used by around 20,000 cyclists each day. Over the next few years the network was extended steadily, reaching 90 kilometres in 2017 and 150 kilometres in 2019. It then continued to grow, arriving at 220 kilometres in 2021 and 300 kilometres by 2023 — six times the length recorded at the start.
The number of daily cyclists rose in step with this expansion. From 20,000 in 2015, it climbed to 30,000 in 2017 and 50,000 in 2019, before reaching 70,000 in 2021 and finally 95,000 in 2023. This represented an almost five-fold increase over the eight years, closely mirroring the growth in the cycle-lane network.