Breakdown of tourist spending (pie chart)
IELTS Academic Task 1 pie chart showing how international tourists distributed their spending across categories in 2023.
Band 6.5
Prompt: The pie chart below shows how international tourists distributed their spending across five categories in 2023. Summarise the information by selecting and reporting the main features, and make comparisons where relevant.
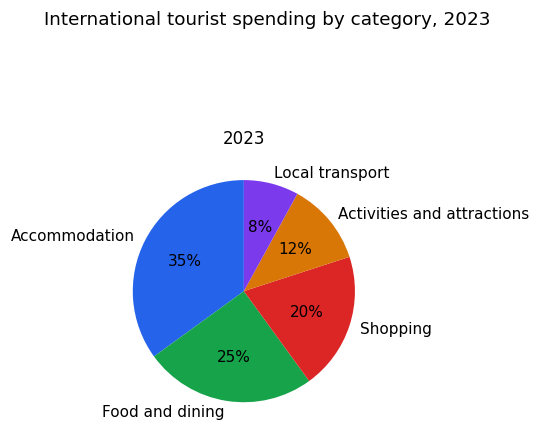
The pie chart shows how international tourists distributed their spending across five categories in 2023.
Overall, accommodation took up the largest share of tourist spending, while local transport received the smallest proportion. The top three categories together made up the majority of all spending.
Accommodation was the biggest expense, accounting for 35% of total spending. Food and dining came second at 25%, and shopping was close behind at 20%. These three categories made up 80% of the money spent by tourists.
The remaining two categories had much smaller shares. Tourists spent 12% of their money on activities and attractions, and local transport made up the smallest proportion at just 8%.
Band 8.0
Prompt: The pie chart below shows how international tourists distributed their spending across five categories in 2023. Summarise the information by selecting and reporting the main features, and make comparisons where relevant.
The pie chart shows how international tourists distributed their spending across five categories in 2023, expressed as percentages.
Overall, accommodation and food together absorbed the majority of tourist expenditure, while local transport accounted for only a small fraction of the total. Spending was heavily concentrated in the first two categories.
Accommodation represented the largest area of expenditure, accounting for 35 per cent of the total amount spent by tourists. Food and dining formed the second-largest share at 25 per cent, so that these two essentials together made up 60 per cent of all tourist spending.
Shopping was the third most significant category, at 20 per cent, indicating that retail purchases still consumed a notable portion of visitors' budgets. The final two categories were considerably smaller: spending on activities and attractions came to 12 per cent, while local transport made up the smallest proportion, at just 8 per cent. Overall, the chart shows that tourists directed most of their money towards staying and eating rather than towards getting around.