Municipal waste disposal by method (line graph)
IELTS Academic Task 1 practice: describe a line graph showing municipal waste sent to landfill, incineration and composting over two decades.
Band 6.5
Prompt: The line graph below shows the amount of municipal waste disposed of by landfill, incineration and composting in Country X from 2000 to 2020. Summarise the information by selecting and reporting the main features, and make comparisons where relevant.
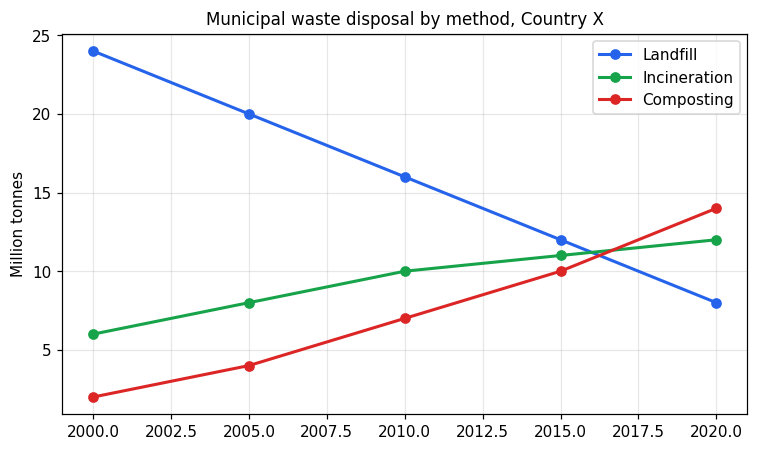
The line graph shows the amount of municipal waste in Country X that was dealt with by landfill, incineration and composting from 2000 to 2020, measured in million tonnes.
Overall, the amount sent to landfill fell steadily, while both incineration and composting increased over the period.
In 2000, landfill was by far the most common method at 24 million tonnes, compared with only 6 million tonnes for incineration and 2 million tonnes for composting. Over the following years, landfill dropped continuously to 16 million tonnes in 2010 and then to 8 million tonnes by 2020. Incineration rose gradually to 10 million tonnes in 2010 and reached 12 million tonnes at the end. Composting increased the fastest in relative terms, going up to 7 million tonnes in 2010 and 14 million tonnes in 2020, when it became the largest method of the three.
Band 7.5
Prompt: The line graph below shows the amount of municipal waste disposed of by landfill, incineration and composting in Country X from 2000 to 2020. Summarise the information by selecting and reporting the main features, and make comparisons where relevant.
The line graph illustrates changes in the quantity of municipal waste in Country X processed through three methods — landfill, incineration and composting — over the two decades from 2000 to 2020, measured in million tonnes.
Overall, there was a clear shift away from landfill towards alternative methods, as landfill volumes fell consistently while both incineration and, in particular, composting rose. By the end of the period the ranking of the three methods had completely reversed.
In 2000, landfill dominated at 24 million tonnes, dwarfing incineration and composting, which stood at just 6 and 2 million tonnes respectively. Thereafter, landfill declined at a steady rate, halving to 12 million tonnes by 2015 and reaching only 8 million tonnes in 2020.
Meanwhile, composting climbed sharply and continuously, overtaking incineration around 2015 before peaking at 14 million tonnes, the highest of any method. Incineration rose more gradually throughout, from 6 to 12 million tonnes, ending marginally below composting.