Average tourist spending per visit (line graph)
IELTS Academic Task 1 line graph showing average tourist spending per visit to Paris, Tokyo and Dubai from 2010 to 2022.
Band 6.5
Prompt: The line graph below shows the average amount, in US dollars, spent by tourists per visit to Paris, Tokyo and Dubai between 2010 and 2022. Summarise the information by selecting and reporting the main features, and make comparisons where relevant.
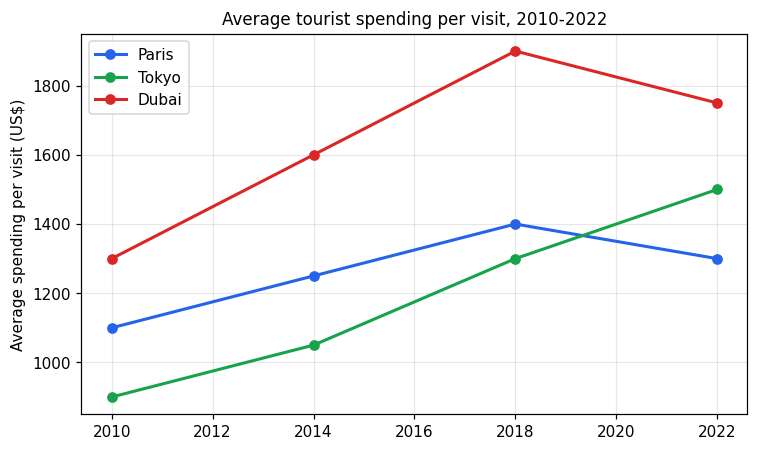
The line graph shows the average amount of money, in US dollars, that tourists spent per visit to Paris, Tokyo and Dubai between 2010 and 2022.
Overall, spending per visit increased in all three cities over the period. Dubai was the most expensive city for tourists for most of the time, while Tokyo was the cheapest at the start but rose strongly by the end.
Dubai had the highest spending throughout. It rose from $1,300 in 2010 to a peak of $1,900 in 2018, before falling to $1,750 in 2022. Paris also went up, from $1,100 in 2010 to $1,400 in 2018, and then dipped slightly to $1,300 in 2022.
Tokyo started as the lowest, at $900 in 2010, but it was the only city to increase in every period, reaching $1,500 in 2022. By the end, Tokyo had overtaken Paris and was close to Dubai.
Band 8.0
Prompt: The line graph below shows the average amount, in US dollars, spent by tourists per visit to Paris, Tokyo and Dubai between 2010 and 2022. Summarise the information by selecting and reporting the main features, and make comparisons where relevant.
The line graph illustrates the average amount, in US dollars, spent by tourists per visit to Paris, Tokyo and Dubai at four-year intervals between 2010 and 2022.
Overall, Dubai attracted the highest spending per visitor throughout the period, while Tokyo rose steadily to overtake Paris. Spending increased in all three cities before 2018, after which both Paris and Dubai experienced a slight fall.
In 2010, tourists spent an average of 1,300 dollars per visit to Dubai, ahead of Paris at 1,100 dollars and Tokyo at 900 dollars, the lowest figure. Spending in Dubai then climbed to a peak of 1,900 dollars in 2018 before dropping back to 1,750 dollars in 2022, where it nonetheless remained the highest.
Paris followed a comparable pattern, rising to 1,400 dollars in 2018 and then declining to 1,300 dollars at the end. Tokyo, by contrast, showed uninterrupted growth, increasing from 900 to 1,500 dollars over the twelve years. As a result, Tokyo, which began as the lowest spender, finished second, comfortably above Paris.