Foreign direct investment in three countries (line graph)
IELTS Academic Task 1 line graph showing foreign direct investment inflows into India, Brazil and Mexico from 2000 to 2020.
Band 6.5
Prompt: The line graph below shows the amount of foreign direct investment, in billions of US dollars, flowing into India, Brazil and Mexico between 2000 and 2020. Summarise the information by selecting and reporting the main features, and make comparisons where relevant.
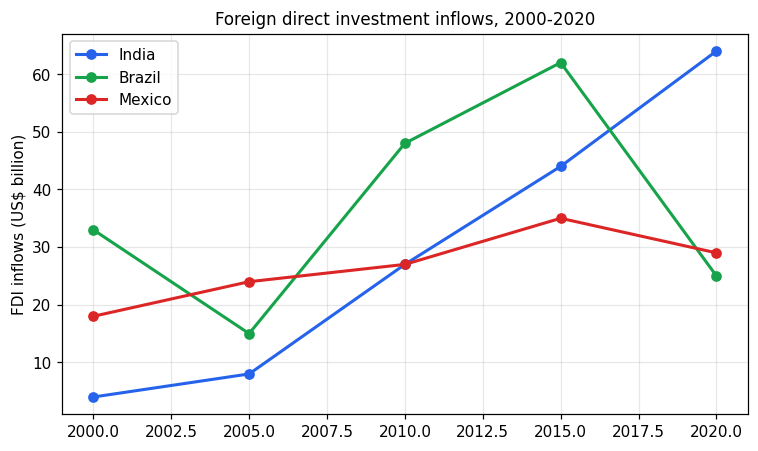
The line graph shows foreign direct investment (FDI) inflows, in billions of US dollars, into India, Brazil and Mexico between 2000 and 2020.
Overall, India's FDI rose steadily throughout and ended the highest, while Brazil's figures were the most changeable and Mexico stayed relatively stable.
In 2000, Brazil had by far the most FDI at 33 billion dollars, while Mexico had 18 billion and India only 4 billion. India then increased continuously, reaching 27 billion in 2010 and 64 billion in 2020, the highest of the three. Brazil fell to 15 billion in 2005 but then climbed to a peak of 62 billion in 2015, before dropping sharply to 25 billion in 2020. Mexico changed little, rising slowly to 35 billion in 2015 and then falling back to 29 billion. By the end of the period, India clearly led the other two countries.
Band 8.0
Prompt: The line graph below shows the amount of foreign direct investment, in billions of US dollars, flowing into India, Brazil and Mexico between 2000 and 2020. Summarise the information by selecting and reporting the main features, and make comparisons where relevant.
The line graph illustrates the amount of foreign direct investment, measured in billions of US dollars, flowing into India, Brazil and Mexico over a twenty-year period from 2000 to 2020.
Overall, India experienced by far the most dramatic growth in investment across the period and finished as the leading recipient, whereas the figures for Brazil fluctuated considerably and those for Mexico rose only modestly.
In 2000, Brazil attracted the highest level of FDI at 33 billion dollars, well ahead of Mexico with 18 billion and India, which received a mere 4 billion. India's inflows then climbed steadily, reaching 27 billion in 2010 and surging to 64 billion by 2020, the highest figure recorded on the graph.
Brazil's investment, by contrast, followed an erratic path: it fell sharply to 15 billion in 2005 before recovering to a peak of 62 billion in 2015 and then collapsing to just 25 billion in 2020. Mexico saw the most stable trend, with its figures increasing gradually from 18 billion to a high of 35 billion in 2015, before dipping to 29 billion at the end of the period.