Theme-park visitors and spending (combined chart)
Academic IELTS Task 1 model answer describing a combined bar-and-line chart of theme-park visitor numbers and average spend by month — chart with band-8 answer.
Band 7.0
Prompt: The chart below shows the number of visitors (bars) and the average spend per visitor (line) at a theme park in each month of one year. Summarise the information by selecting and reporting the main features, and make comparisons where relevant.
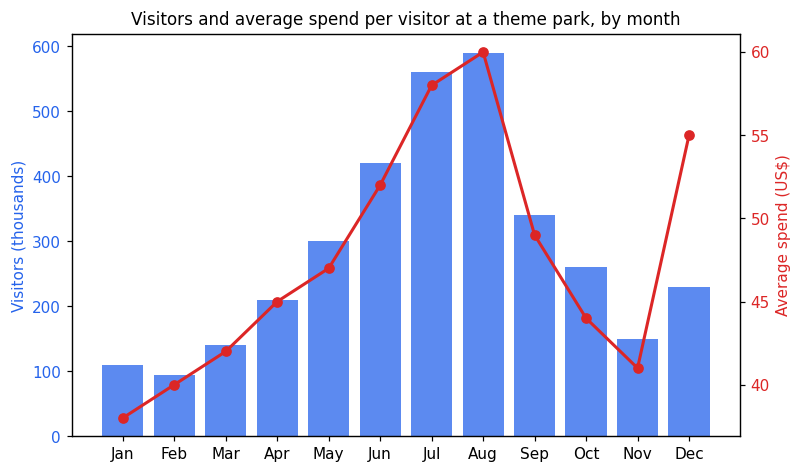
The chart shows how many people visited a theme park in each month of one year, measured in thousands, together with the average amount each visitor spent, in US dollars.
Overall, both visitor numbers and average spending rose through the first half of the year to a peak in summer before falling in autumn. Visitor numbers were far more variable than spending, which stayed within a narrower range.
Visitor numbers began at 110,000 in January and dipped slightly to 95,000 in February, the lowest figure of the year. They then climbed steadily to a peak of 590,000 in August. After August, numbers dropped sharply to 340,000 in September and continued down to 150,000 in November, before rising again to 230,000 in December.
Average spending followed a broadly similar upward trend, increasing from $38 in January to a high of $60 in August. It then fell to $41 by November. Spending then rose again to $55 in December, even though visitor numbers remained relatively low.
Band 8.0
Prompt: The chart below shows the number of visitors (bars) and the average spend per visitor (line) at a theme park in each month of one year. Summarise the information by selecting and reporting the main features, and make comparisons where relevant.
The chart combines a bar graph showing the number of visitors to a theme park each month, in thousands, with a line showing the average amount each visitor spent, in US dollars, over one year.
Overall, both visitor numbers and average spending followed a broadly seasonal pattern, peaking in the summer and falling in the winter months. The two measures generally rose and fell together, although spending was far less volatile than attendance.
Visitor numbers were lowest in the winter, at around 95,000–110,000 in January and February, then climbed steeply through spring to a peak of 590,000 in August. After August, attendance dropped sharply, reaching 150,000 by November before a modest rise in December.
Average spend per visitor moved within a much narrower band, between about US$38 and US$60. It, too, was highest in the peak summer months, reaching US$60 in August, and lowest in winter. An exception occurred in December, when relatively modest visitor numbers were accompanied by comparatively high spending of US$55, suggesting that festive visitors spent more per head than the quiet season would imply.